Bio Experiential Learning Project
Development of a Low-Cost Smart Biosensor for Health Monitoring
A wearable prototype that reads heart rate, blood oxygen and body temperature, and shows them on a screen and a phone, for about ₹1,400 in parts.
See the readings- Heart rate
- -- bpm
- SpO₂
- -- %
- Temperature
- -- °C
Simulated signal for demonstration
Why this project
Regular health checks need clinic visits and equipment that many people cannot afford or reach. Chronic conditions such as hypertension, diabetes and respiratory illness need frequent monitoring, not a yearly test.
Commercial smart wearables solve part of this, but they cost a lot and lock data inside their own apps. Our aim is a sensor that students, village health workers and families can build, repair and understand.
- Affordable. Parts under ₹1,500.
- Accurate enough to be useful. Checked against a hospital-grade pulse oximeter.
- Open. Readings saved as plain CSV anyone can analyse.
How the sensor works
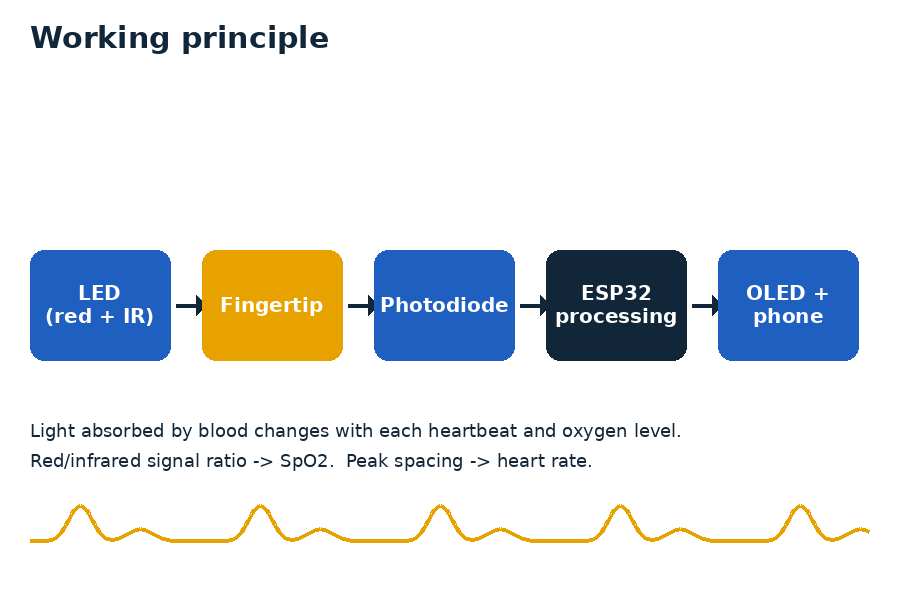
The sensor shines red and infrared light into the fingertip. Blood absorbs light differently depending on how much oxygen it carries, and the amount absorbed rises and falls with every heartbeat.
- Sense. A photodiode measures the light that comes through the tissue.
- Process. The microcontroller filters noise and finds each pulse peak. Beats per minute come from the gap between peaks.
- Calculate SpO₂. The ratio of red to infrared signal strength is converted to an oxygen percentage.
- Show. Values appear on the OLED screen and are sent to a phone over Bluetooth.
Bio-signal lab
See what the sensor sees. A simulated fingertip signal is processed the same way the device does it, step by step. Add hand movement and watch the signal quality drop.
1. Raw light signal
Infrared light reaching the photodiode. Each dip is a heartbeat absorbing more light.
2. Cleaned signal and detected beats
Slow drift removed and noise smoothed. White dots are the beats used for heart rate.
- Heart rate
- -- bpm
- SpO₂
- -- %
- Perfusion
- -- %
How the quality score works
The score is the weakest of three checks on the last 6 seconds of signal. Steady rhythm: gaps between beats should be similar. Low noise: little jitter left after smoothing. Even pulse strength: beat heights should not jump around. Below 45 the readings are hidden, because movement makes the red and infrared light change together, which drags SpO₂ falsely towards 85%. Real oximeters hold back readings for the same reason.
The build and its cost
| Part | Job | Approx. cost (₹) |
|---|---|---|
| ESP32 board | Processing and Bluetooth/Wi-Fi | 450 |
| MAX30102 sensor | Heart rate and SpO₂ | 250 |
| DS18B20 probe | Skin temperature | 120 |
| 0.96" OLED display | Readout | 250 |
| Li-ion cell and charger | Power | 230 |
| Wires, strap, case | Assembly | 100 |
| Total | 1,400 | |
Prices are estimates for Indian online retailers. Update them with your own receipts.
Sample readings
Showing data/sample-data.csv. Upload your own CSV (columns: time_s,hr,spo2,temp, plus optional sys,dia typed in from a blood-pressure cuff) to plot it. Coloured bands show the healthy range.
View raw data
My fitness and food plan
Built from your details and the readings above (sample data until you upload your own). General guidance from standard formulas, not medical advice: check with a doctor or dietitian, especially if you have a health condition.
8-week activity plan
Minutes of moderate activity per week, building up slowly.
Daily food chart
Today's food log
Notes for you
About this project
Team
Your name, register number
Teammate names
Guide: faculty name
Department, college name
Limitations
This is a learning prototype, not a medical device. Readings can drift with finger movement, cold hands and nail polish. Do not use it to diagnose or treat any condition.